
States that are Leading the Transition to a Clean Energy Economy
California Metro Areas also Top Annual U.S. Clean Tech Leadership Index Rankings from Clean Edge
by Clint Wilder, Senior Editor, Clean Edge
 At a time of notable acceleration in the nation’s transition to a clean energy economy, California leads all states in clean tech leadership for the seventh consecutive year, according to annual rankings released in May 2016 by Clean Edge, a leading clean tech research and advisory firm.
Based in Portland, Oregon, and the San Francisco Bay Area, Clean Edge annually benchmarks all 50 states and the 50 largest U.S. metro areas on dozens of metrics covering clean energy, clean transportation deployment, policy leadership, financial investments in the clean tech sector, and relevant human and intellectual capital. In the 2016 U.S. Clean Tech Leadership Index, California retained its seven-year hold on the #1 ranking in the Technology category, while swapping places with Massachusetts in the other two categories: Policy and Capital. The solar power capital of the U.S. in both industry presence and deployment, California generated more than 15,000 utility-scale Gwh (Gigawatt hours) and more than 5,000 distributed GWh of power from the sun in 2015, both the most in the nation by far.
California captured the best score in the Policy category for the first time, spearheaded by its aggressive RPS (Renewable Portfolio Standard) increase to 50 percent renewables by 2030 (from 33 percent in 2020, which the state’s investor-owned utilities say they are on track to meet). California ceded the top spot in Capital to its cross-country rival, Massachusetts; the two states have occupied the top two places in Capital in every edition of the Index back to 2010. All quantified indicators in the Clean Edge rankings are normalized for population.
 But Vermont is arguably the big story of the top 10, making a three-place jump from the previous year to #3, an unprecedented surge at that level of the rankings. Vermont knocked Oregon down one spot to fourth, while New York held onto to the #5 ranking for the third straight year. The rest of the top 10 are closely bunched; just 5.4 points separate the sixth and tenth place states. Colorado dropped two places to sixth, while #7 Illinois and #8 Connecticut swapped places from 2015. Washington State (after three straight years of declining rankings) and Hawaii held steady at ninth and 10th, respectively. Just missing the top 10 were Maryland and Rhode Island, which each improved by five places to #11 and #12, respectively.

Accelerating Transition
The 2016 Index results come at a time of notable acceleration in the nation’s transition to a clean energy economy, where an increasing number of cities, states, and companies are raising their renewable energy targets, green buildings are becoming the standard, and energy storage and EVs are moving into the mainstream.
At the state level, the transition to a clean energy economy over the past seven years has been remarkable. In 2015, 14 states exceeded 10 percent in-state generation from non-hydro renewables (up from just one state in 2010). The top three states (Iowa, South Dakota, and Kansas) were at 31 percent, 25 percent, and 24 percent respectively. And it’s not just wind generation – in this year’s Index, California became the first state to generate 10 percent of its in-state electricity from utility-scale and distributed solar, with Hawaii not far behind at 7 percent.

This dramatic shift (more than 60 percent of all new U.S. electricity generating capacity additions last year came from solar and wind) represents both the maturation of the clean-energy sector and a deployment landscape that seemingly transcends politics. Among the top 10 states for utility-scale clean electricity generation (not including hydro), half were red states during the last presidential election (Idaho, Kansas, North Dakota, Oklahoma, and South Dakota) and half were blue (California, Colorado, Iowa, Minnesota, and Vermont).
And it’s not just utility-scale renewables that pierce the myth of a red-blue divide when it comes to clean energy deployment. This year’s Top 10 states for EV – Electric Vehicle registrations (normalized for population) include three red states (Arizona, Georgia, and Utah) and two that are purple (swing) states in the current election cycle (Colorado and Nevada). For smart meter penetration, red states represent half of the Top 10 spots: Georgia (87 percent), Arizona (74 percent), Alabama (72 percent), Idaho (71 percent), and Texas (70 percent). In some indicators, such as LEED green building deployment, coastal and left-leaning states dominate the Top 10, while in others, such as demand response peak demand shaved, more red states lead.
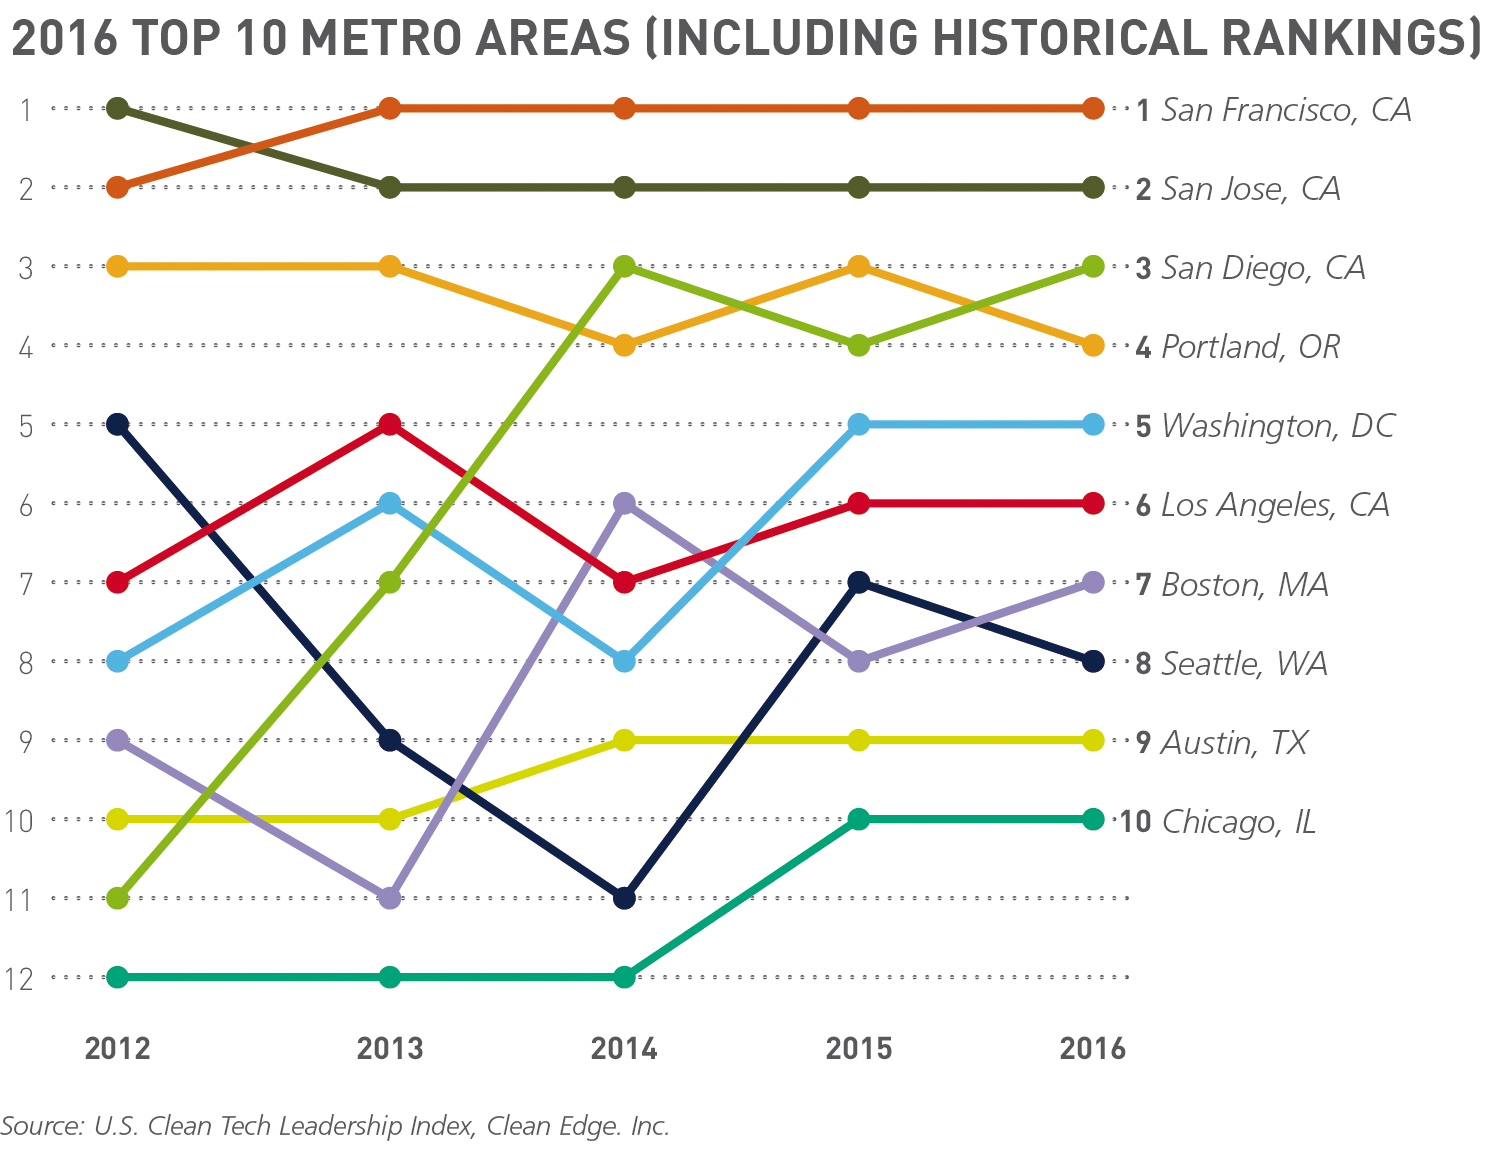
California Cities Lead, as Well
California also dominates the 2016 Metro Clean Tech Leadership Index, with its largest cities capturing the top three places and four of the top six. The San Francisco Bay Area’s leadership continues into its fifth year: San Francisco and San Jose have finished in the top two for each year the Index has been run, with San Francisco leading the pack for the last four years. However, San Francisco’s lead has narrowed considerably, going from nearly 15 points in the 2014 Index to just 2.5 points in 2016. That being said, the two neighboring metros remain head and shoulders above the rest of the field, with #3 San Diego finishing more than 30 points behind San Jose.
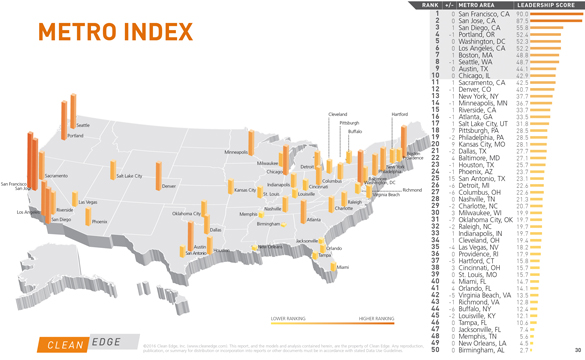
The top 10 metros returned intact this year from the 2015 Index, while their order changed only slightly. San Diego snagged the third spot from fourth-place Portland, Ore., with Washington, DC (#5), and Los Angeles (#6) following, but the difference between #4 Portland and #6 Los Angeles is only .15 points. Boston (#7) and Seattle (#8) change places, though they are virtually tied with only .03 points between them. Austin and Chicago round out the top 10, as they did in last year’s Index.
 Among states, the Technology category tracks the progress of states’ deployment across three subcategories: Clean Electricity (renewable energy generation, energy storage, fuel cell deployment), Clean Transportation (use of electric vehicles, hybrids, plug-in hybrids, biofuels, natural gas vehicles, charging/fueling infrastructure), and Energy Intelligence & Green Building (green building projects, smart grid deployment). For the seventh straight year, California leads the Technology category in 2016 by a substantial margin.
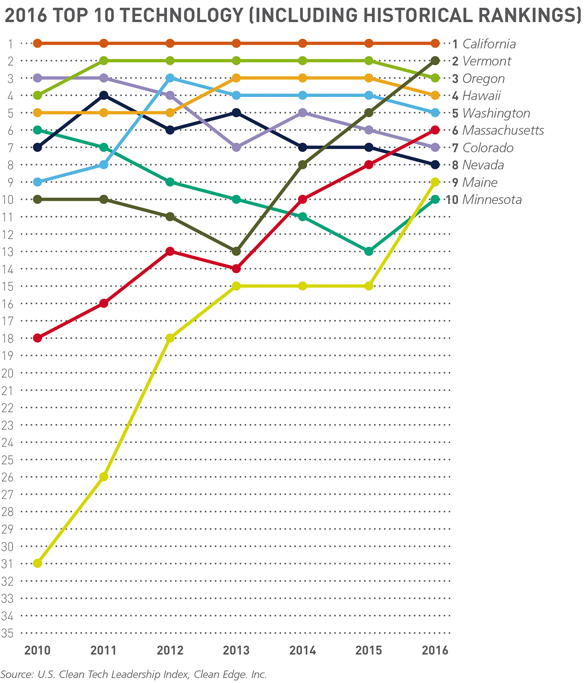
But the historical trajectories of the top 10 Technology states over the Index’s seven years show two New England states – Massachusetts and Maine – moving from also-rans to national leaders alongside Vermont and the traditional resource-rich clean-energy deployment champions from the West and Midwest. Massachusetts, #18 in 2010, has improved its ranking every year but one and claimed its highest-ever place of sixth in 2016. The Bay State jumped four places in utility-scale generation, and ranks in the top 10 in utility-scale solar, distributed solar, energy storage (#1), hybrid and plug-in hybrid vehicles, and EV charging stations. Maine, the national leader in biomass generation, joined the top 10 for the first time this year at #9 after three years at 15th; back in 2010, the state was a lowly 31st. Nevada (26th in the overall Index), Maine (18th) and Minnesota (15th) are the three Technology top 10 states ranking lowest overall in the Leadership Index.
Vermont’s Remarkable Rise
Although helped by the “law of small numbers” – Vermont’s population is 49th in the nation, about 1/60th that of California’s – its rise to the top is nonetheless remarkable. With its Vermont Yankee nuclear plant shuttered in late 2014, the tiny state has significantly increased both renewables and efficiency. Vermont jumped 11 places in the Index’s utility-scale clean electricity generation indicator (solar, wind, and geothermal as a percentage of total generation) from 16th to fifth, with 18.6 percent. Add in the state’s notable hydro and biomass generation, and the state was virtually 100 percent clean energy-powered in 2015, at 99.8 percent. And this snowy winter paradise in northern New England is #3 in the nation in its share of electrons from both utility-scale solar (behind California and Nevada) and distributed PV – Photovoltaic (behind Hawaii and California).
Other Findings
Wind power remains the biggest contributor of clean electrons in most states with significant percentages of in-state clean electricity generation. A dozen states generated at least 10 percent of their power from wind in 2015 (with Texas’s 9.98 percent rounded up); perennial leader Iowa topped the field once again, this time exceeding the historic 30 percent threshold at 31.3 percent. South Dakota and Kansas surpassed 20 percent. Vermont impresses here too, ranking #8 in the indicator (a 12-place jump from the previous year) at 15.5 percent; it’s the only Eastern state in the top 10.
In the Metro Index, the Clean Electricity and Carbon Management category ranks metro areas based on the extent to which they use renewable electricity and have, or are committed to having, low carbon emissions. The West Coast has almost completely taken over leadership in this category, with all six California cities and the two Pacific Northwest metros appearing in the top 10. San Jose (up four spots to #1), San Francisco, San Diego, and Los Angeles give the Golden State a top-four sweep, with 2015 category leader Portland, Sacramento, and Seattle filling the 5-7 slots and Riverside coming in ninth. Austin (#8) and Boston (#10) are the only top 10 metros not located on the West Coast.
This category consists of a mixture of qualitative and quantitative measures. The quantitative indicators include two that use state-level electricity generation data as a proxy for local clean electricity; one that measures carbon emissions from large industrial and power-producing facilities; and a new indicator measuring installed solar power in each metro’s principal city. The qualitative measures have increased this year, with new indicators giving credit for reporting and reducing carbon emissions, and for setting high renewable electricity goals.

The regional electricity mix indicator leaders are virtually unchanged from 2015. Metros in leading solar states such as California and Nevada mix with wind-dominant places like Oklahoma City, Minneapolis, and Denver to set the pace in the indicator that includes only wind, solar, and geothermal. The equation changes when adding hydro and biomass: Seattle and Portland vault to the top of the charts, followed by the California metros.
Article by Clint Wilder, senior editor at leading clean-tech research and advisory firm Clean Edge (www.cleanedge.com). He has been writing and speaking about the clean-tech industry for more than a decade. He is co-author of two books, Clean Tech Nation: How the U.S. Can Lead in the New Global Economy (HarperCollins, 2012) and The Clean Tech Revolution (HarperCollins, 2007). Clint is a frequent speaker at clean-tech and green business events in the U.S. and overseas, a blogger for the Green section of The Huffington Post, and has been a facilitator in the Energy and Climate Change track of the Clinton Global Initiative. Clint is also a board member of RE-volv, a San Francisco non-profit using crowdfunding to finance solar power on community-based organizations.